If you want to compare two sets of measurements and see whether the difference between them is real or just down to chance, the T.TEST function in Google Sheets gives you the probability that they came from the same population.
In this article, I’ll show you how to run T.TEST in four common setups: a paired before-and-after, two classes assumed to have equal variance, two independent groups using Welch’s variant, and a one-tailed training test.
T.TEST Function Syntax in Google Sheets
Here is how the T.TEST function is written:
=T.TEST(range1, range2, tails, type)
- range1 is the first sample of numbers.
- range2 is the second sample of numbers.
- tails is either 1 or 2. Use 1 for a one-tailed test (you only care about a change in one direction), and 2 for a two-tailed test (any difference counts).
- type is 1, 2, or 3. Use 1 for a paired test, 2 for a two-sample test with equal variance, and 3 for a two-sample test with unequal variance (Welch’s).
T.TEST hands back a p-value, a probability between 0 and 1. A small p-value (typically below 0.05) suggests the two samples come from genuinely different populations.
Note: TTEST without the dot is the legacy alias of T.TEST. Both names behave the same way in Google Sheets, so feel free to use either one.
When to Use T.TEST Function
- Check whether a before-and-after measurement (weight loss, training, treatment) shows a real change.
- Compare scores or measurements from two groups, classes, or product variants.
- Decide whether a marketing test, A/B test, or experiment hit statistical significance.
- Test whether a one-directional change (improvement, increase) is meaningful rather than noise.
- Pair with descriptive stats like AVERAGE and STDEV to summarize the two samples alongside the test.
Example 1: Paired Two-Tailed T-Test on Before and After
Let’s start with the most common setup, a paired test on the same people measured twice.
Below is the dataset, with participant names in column A, their weight before a program in column B, and their weight after in column C, across rows 2 to 7.
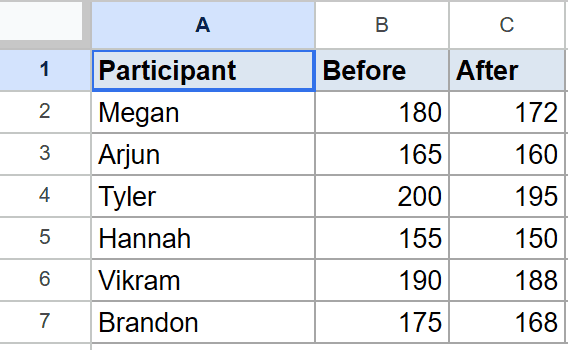
You want to know whether the change in weight from Before to After is statistically meaningful, in either direction.
Here is the formula:
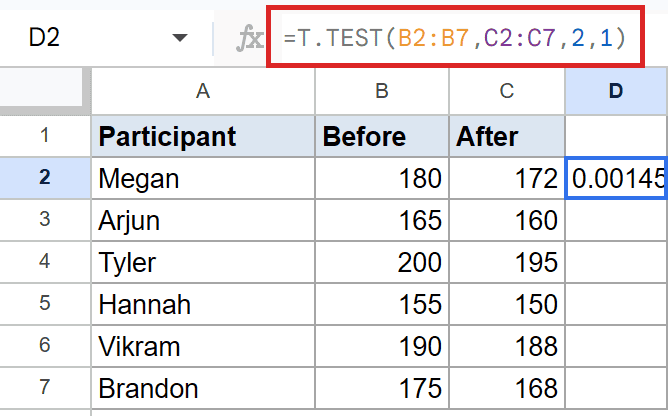
=T.TEST(B2:B7,C2:C7,2,1)
How this formula works:
- The first two arguments are the Before and After columns. Same six participants, two measurements each.
- The third argument, 2, asks for a two-tailed test. You care about any change, not just a drop.
- The fourth argument, 1, marks this as a paired test. Each row is the same person.
The p-value Sheets calculates here is small, well below the usual cutoff most analysts work with. That’s the standard signal that the before-and-after difference is unlikely to be chance.
Pro Tip: For a paired test (type=1), the two ranges must be the same length. Each row in range1 has to pair with the same row in range2. If the ranges have different sizes, T.TEST returns a #N/A error. Type 2 and type 3 don’t have that restriction.
Example 2: Two-Sample Equal Variance Across Two Classes
When the two groups are different people but you can reasonably assume their spread is similar, use type 2.
Below is the dataset, with Class A scores in column A and Class B scores in column B, across rows 2 to 7. Six students per class, different students in each column.
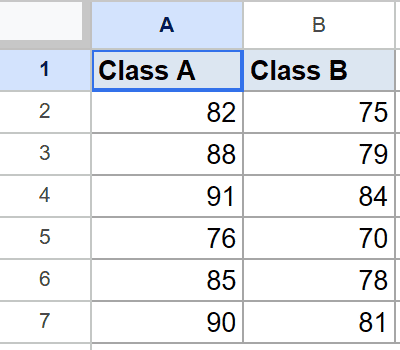
You want to know whether the average score in Class A is genuinely different from Class B.
Here is the formula:
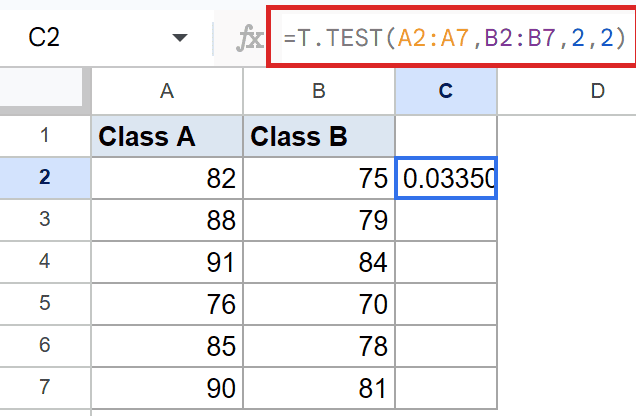
=T.TEST(A2:A7,B2:B7,2,2)
How this formula works:
- The first two arguments are the two class score columns. The rows don’t pair up. Row 2 of Class A isn’t the same student as row 2 of Class B.
- Two-tailed (3rd arg = 2) keeps the test general. Any difference counts.
- Type 2 (4th arg = 2) assumes both classes have similar variance in their scores.
You’ll see a small probability in the result cell. When it lands below the common cutoff, that’s the typical signal that the two class averages are different in a way that isn’t just noise.
Example 3: Welch’s Test on Two Independent Groups
If the two samples might have different spread, use type 3. This is Welch’s t-test, the safer default when you aren’t sure the variances match.
Below is the dataset, with Group 1 values in column A and Group 2 values in column B, across rows 2 to 7.
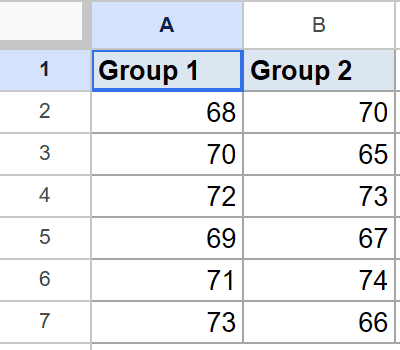
You want to compare the two groups without assuming they have the same variance.
Here is the formula:
=T.TEST(A2:A7,B2:B7,2,3)
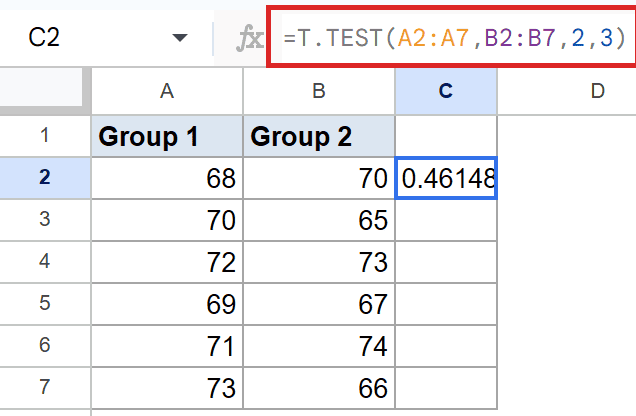
The first three arguments work the same way as Example 2. The only change is the fourth argument, 3, which switches to the Welch variant.
In this dataset the probability you’ll see in the cell sits well above the common cutoff. That’s the standard signal that the two groups aren’t different enough to call meaningful from this small sample. Welch’s is generally the safer choice for independent-sample tests because it doesn’t make the equal-variance assumption.
Pro Tip: When in doubt between type 2 and type 3, pick type 3. Welch’s test reports almost the same answer as type 2 when the variances really are equal, and a more honest answer when they aren’t. Type 2 is the right choice mainly when you have prior knowledge that the variances match. To flag the result automatically as significant or not, wrap T.TEST in an IF function like `=IF(T.TEST(A2:A7,B2:B7,2,3)<0.05,"Significant","Not significant")`.
Example 4: One-Tailed Paired Test for a Training Effect
When you specifically want to test whether the change went in one direction (an improvement, an increase), drop the tails argument to 1.
Below is the dataset, with trainee names in column A, pre-training scores in column B, and post-training scores in column C, across rows 2 to 7.
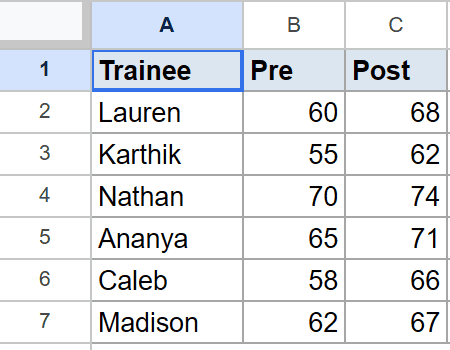
You want to test whether the post-training scores went up, not just whether they changed.
Here is the formula:
=T.TEST(B2:B7,C2:C7,1,1)
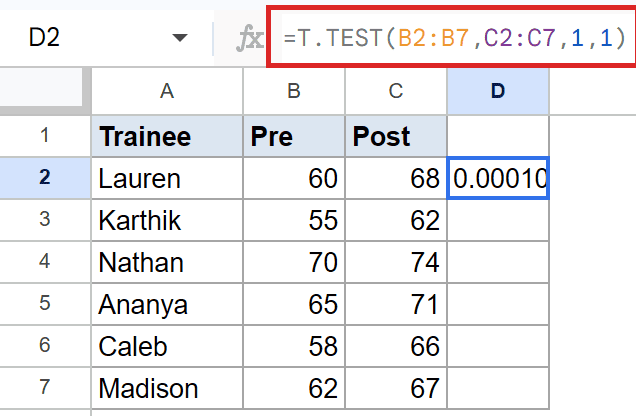
How this formula works:
- The first two arguments are the Pre and Post score columns. Paired by row, same trainees.
- The third argument, 1, runs a one-tailed test. You only care about an upward shift.
- The fourth argument, 1, is the paired type (same as Example 1).
The p-value here will be very small. Well below the common cutoff, that’s the standard signal that the training had a real upward effect. A one-tailed test reports a smaller p-value than the two-tailed version when the change is in your predicted direction, so use it only when your hypothesis really is directional.
Tips & Common Mistakes
- A small p-value means “different”, not “by how much”. T.TEST tells you whether the difference is bigger than chance would explain. It doesn’t tell you whether the effect is large enough to matter in practice. Pair it with the actual averages of both samples (or a SUM over each range divided by the count) to see the size of the gap.
- Pick tails before you look at the result. Picking one-tailed after seeing the data, just to clear the 0.05 cutoff, isn’t valid. Decide whether your hypothesis is directional or not when you set up the test, and stick with that choice.
- Use the right type for your data. Type 1 (paired) is for the same subjects measured twice. Types 2 and 3 are for independent groups, with type 3 being safer when you can’t assume equal variance. Mixing these up can flip your conclusion.
T.TEST gives you a quick, single-number answer to “are these two samples really different?” Hand it your two ranges, pick a tails value, pick a type, and the function does the rest.
For most independent-sample comparisons, type 3 is the safest choice. For paired before-and-after measurements, type 1 is the one you want. Use the resulting p-value against your usual cutoff (0.05 is the common default) to make the call.