
STDEV calculates sample standard deviation in Google Sheets. It measures how spread out numeric observations are around their mean, in the same units as the observations.
Use the sample calculation when your observations represent a larger population. If your data contains the entire population you want to describe, use STDEVP or STDEV.P instead.
STDEV function syntax
=STDEV(value1, [value2, ...])- value1: the first numeric value or range.
- value2 and later arguments: optional additional values or ranges.
The Google STDEV reference describes the function arguments.
Example data
Enter this dataset starting in A1. Leave cells marked “leave empty” empty; type any displayed formula as a formula. Keep a separate blank area for the results.
| Student | Score |
|---|---|
| A | 70 |
| B | 80 |
| C | 90 |
| D | 100 |
| E | Absent |
| F | (leave empty) |
The examples below use this dataset unless the formula supplies its own values. Array results need enough empty cells to expand. The formulas use commas as argument separators. Your spreadsheet locale may require semicolons.
Calculate sample standard deviation
The four numeric scores are 70, 80, 90, and 100. Their sample standard deviation is approximately 12.91 points; Absent and the empty cell are ignored.
=STDEV(B2:B7)Result: 12.90994449
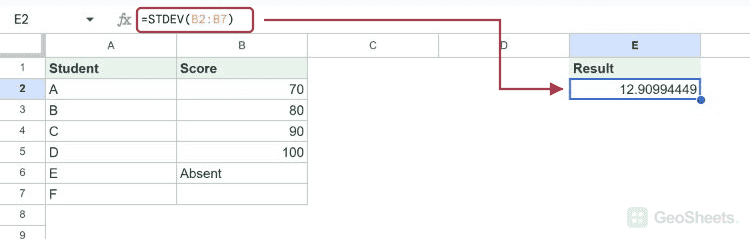
STDEV.S is an alternative name for the sample calculation and returns the same result.
=STDEV.S(B2:B7)Result: 12.90994449
Compare a set of measurements
These readings cluster around 10. Their sample standard deviation is approximately 0.1581 in the same measurement units.
=STDEV({10;10.2;9.8;10.1;9.9})Result: 0.158113883
Combine ranges or filter observations
Multiple arguments are pooled into one collection of observations. This is not the average of separate standard deviations.
=STDEV({70;80},{90;100})Result: 12.90994449
FILTER selects numeric scores at least 80 before STDEV calculates their spread.
=STDEV(FILTER(B2:B7,B2:B7>=80,ISNUMBER(B2:B7)))Result: 10
Choose sample or population standard deviation
Treating these four scores as the whole population gives approximately 11.18. The population formula divides the squared-deviation total by n; the sample formula uses n – 1.
=STDEVP(B2:B7)Result: 11.18033989
Check zeros, errors, and too few observations
Zero is a numeric observation and is included.
=STDEV({10;0;20})Result: 10
One numeric observation is insufficient for sample standard deviation, so the result is #DIV/0!.
=STDEV(10)Result: #DIV/0!
An input error propagates. STDEV does not silently discard error cells.
=STDEV({10;NA();20})Result: #N/A
Other Google Sheets articles you may also like