MODE Function in Google Sheets

If you want to find the value that shows up most often in a column of numbers, the MODE function in Google Sheets does it in one step. You point it at a range and it returns the most frequent number.

I’ll walk through five examples, covering scores, daily counts, tied frequencies, a two-column range, and how MODE stacks up against AVERAGE and MEDIAN.

MODE Function Syntax in Google Sheets

MODE returns the most commonly occurring number in a dataset.

=MODE(value1, [value2, ...])
  • value1 is the first value or range to check.
  • value2, … are extra values or ranges (optional). You can pass several ranges or individual numbers.

When to Use MODE Function

  • Find the test score, rating, or response that students or customers gave most often.
  • Spot the most common daily order count, ticket count, or visitor count in a log.
  • Pull the most frequent quantity, price, or duration from a column of records.
  • Compare the most common value against the average and median to see how the data leans.
  • Identify the dominant choice in a survey or poll column.

Example 1: Find the Most Common Test Score

Let’s start with the most common job, finding the score that shows up most often.

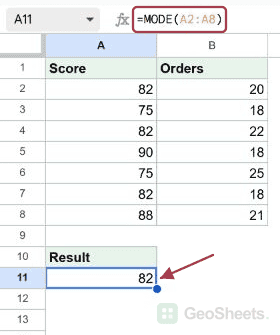
Below is the dataset. Column A has a list of test scores from seven students.

I want the most frequent score in that column.

Google Sheets displaying "Score" in A1 and a range of numeric values in A2:A8.

Here is the formula:

=MODE(A2:A8)
Google Sheets: Formula bar with =MODE(A2:A8) highlighted, B2 shows result 82.

MODE scans column A and counts how often each number shows up. The score 82 appears three times, more than any other, so the result is 82. Every other score is matched once or twice.

If you want the average instead of the most-common value, the AVERAGE function does that job. The two answer different questions on the same column.

Example 2: Mode of Daily Order Counts

The same idea works on any column of repeated numbers.

Below is the dataset. Column A lists the day and column B lists the number of orders that came in.

I want the order count that repeats the most often across the week.

Google Sheets MODE function example 2: daily orders from Monday to Sunday.

Here is the formula:

=MODE(B2:B8)
Google Sheets: `=MODE(B2:B8)` in formula bar calculates 18 in C2.

MODE looks at the orders column and finds that 18 shows up three times, on Tuesday, Thursday, and Saturday. No other value repeats that often, so the result is 18.

Notice MODE ignores the day labels in column A. It only works on numbers, so the text column is left alone.

Example 3: Mode With Tied Frequencies

Sometimes two numbers tie for the most frequent. MODE has a clear rule for that.

Below is the dataset. Column A has six product ratings, and a few of them repeat.

I want to see what MODE picks when more than one value is tied for the lead.

Google Sheets showing "Rating" in A1 and numeric values 4, 5, 3, 4, 5, 3 in A2:A7.

Here is the formula:

=MODE(A2:A7)
Google Sheets with `=MODE(A2:A7)` formula in the bar, returning 4 as the mode in cell B2.

Here 4, 5, and 3 each show up twice, so all three are tied for most common. MODE breaks the tie by picking the value that appears first in the range, which is 4.

That’s worth remembering. If your data has ties, MODE gives you only one answer, and it’s the one nearest the top of the range.

Pro Tip: If you want every tied mode instead of just the first, use MODE.MULT. It spills an array of all the values tied for most common, so you see every one of them. Plain MODE returns #N/A only when no value repeats at all.

Example 4: Mode Across a Two-Column Range

You aren’t limited to a single column. MODE works on any rectangular block of numbers.

Below is the dataset. Column A has scores from Week 1 and column B has scores from Week 2.

I want the most common score across both weeks combined.

Google Sheets showing "Week 1" and "Week 2" columns with numeric data for a MODE function example.

Here is the formula:

=MODE(A2:B6)
Google Sheets: Formula bar shows =MODE(A2:B6) for cell C2, which displays 7.

When you pass MODE a multi-column range, it treats every cell in that block as part of one dataset. The number 7 shows up three times across the ten cells, more than any other, so the result is 7.

This is handy when your data is spread across a small grid and you don’t want to flatten it into one column first.

Example 5: Compare Mode With Average and Median

Mode tells a different story than the average. Putting them side by side makes the difference obvious.

Below is the dataset. Column A has seven sales figures, and you can already see one number repeats more than the rest.

I want the most common sale value so I can compare it to the average and median later.

Google Sheet showing Sales data in A1:A8, a dataset for the MODE function.

Here is the formula:

=MODE(A2:A8)
Google Sheets: MODE formula in B2 returns 100 for range A2:A8.

The value 100 appears three times in column A, more than any other figure, so MODE returns 100. The average of the same column is closer to 157 because the larger sales of 200 and 300 pull it up.

That’s the lesson. When a dataset has a few large outliers, the mode often gives you a better feel for what’s typical than the average does.

Tips & Common Mistakes

  • MODE only looks at numbers. Text cells, blank cells, and boolean values are skipped. If column B mixes numbers with text labels, MODE quietly ignores the labels and crunches what’s left.
  • #N/A means no repeats. If every value in your range is unique, MODE returns #N/A. That’s the signal that no number is more common than any other. A quick fix is to widen the range or check the data for typos.
  • Use MODE.MULT for tied modes. Plain MODE picks only the first of a tie, which can hide the full story. MODE.MULT spills every tied value into the cells below, so you see all of them in one go.

MODE is the quickest way to surface the value a column keeps coming back to.

You’ve now seen it on test scores, order counts, tied ratings, a two-column block, and a sales column with outliers. Point it at the column you care about and it does the counting.

List of All Google Sheets Functions

Related Google Sheets Functions / Articles: