If you want to see how many values fall into each bucket of a number range, the FREQUENCY function in Google Sheets does it in one shot. You hand it a list of numbers and a list of bin edges, and it counts how many values land in each bin.
In this article, I’ll show you how to use FREQUENCY with test scores, age groups, sales tiers, and decimal response times.
FREQUENCY Function Syntax in Google Sheets
The FREQUENCY function returns a vertical array of counts showing how often values appear inside each bin range.
=FREQUENCY(data, classes)
- data is the range of numbers you want to bucket.
- classes is the range of bin edges. Each bin counts values less than or equal to that edge and greater than the bin below it.
When to Use FREQUENCY Function
- Build a histogram by counting how many values fall into each numeric range.
- Group test scores into grade buckets without writing a string of nested IF function checks.
- Bucket ages, prices, response times, or any other numeric metric into tiers.
- Get a quick distribution of your data before charting it.
- Replace several COUNTIFS calls with one short formula.
Example 1: Count Test Scores in Grade Buckets
Let’s start with the classic case, sorting exam scores into grade ranges.
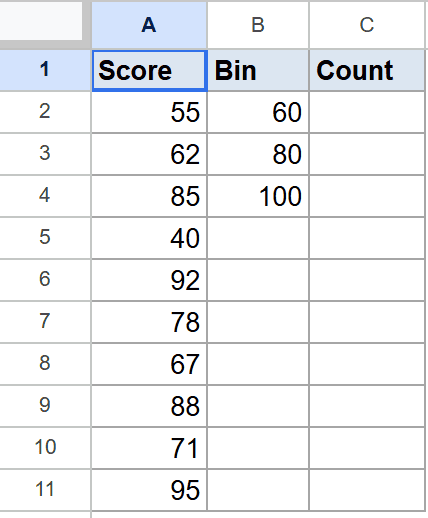
Below is the dataset. Column A has ten test scores and column B has three bin edges at 60, 80, and 100.
I want to know how many scores fall into each grade bucket.
Here is the formula:
=FREQUENCY(A2:A11, B2:B4)
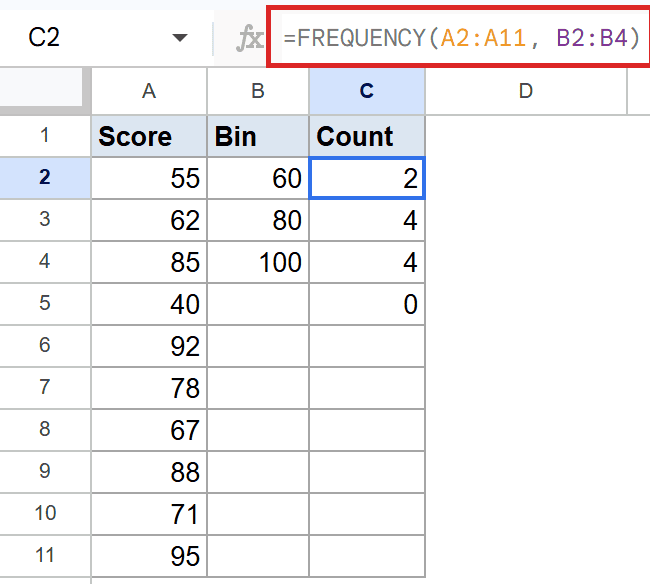
FREQUENCY spills four values down column C, one for each bin plus an overflow row. Two scores are 60 or below, four scores sit between 61 and 80, four more land between 81 and 100, and zero scores go above 100.
Notice the output is one row taller than the bins list. That extra row at the bottom catches anything above the highest bin edge.
Pro Tip: Bin edges are inclusive of the upper bound. A score of exactly 80 lands in the 61 to 80 bucket, not the 81 to 100 one. Plan your edges accordingly.
Example 2: Group Ages Into Demographic Brackets
Same shape, different data. Here we bucket a list of ages.
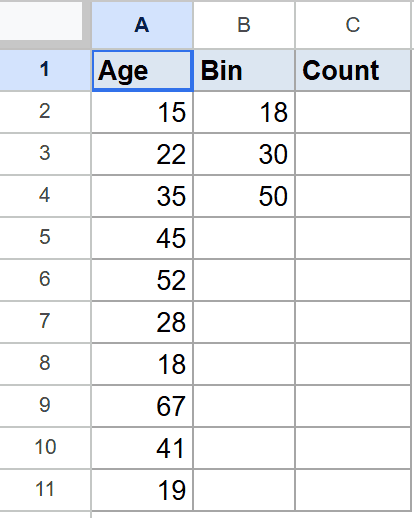
Below is the dataset. Column A has ten ages and column B has bin edges at 18, 30, and 50.
I want a count of people in each age bracket.
Here is the formula:
=FREQUENCY(A2:A11, B2:B4)
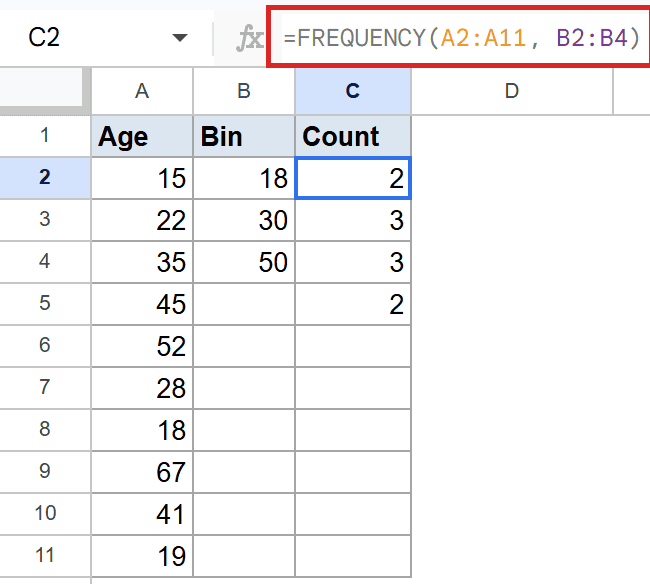
The output splits the ten ages across four brackets. Two people are 18 or younger, three fall between 19 and 30, three more sit between 31 and 50, and two are above 50.
The same formula shape works whether your data is exam scores, ages, or anything else numeric. Only the bins change.
Example 3: Bucket Order Amounts Into Sales Tiers
FREQUENCY also works well for breaking sales orders into price tiers.
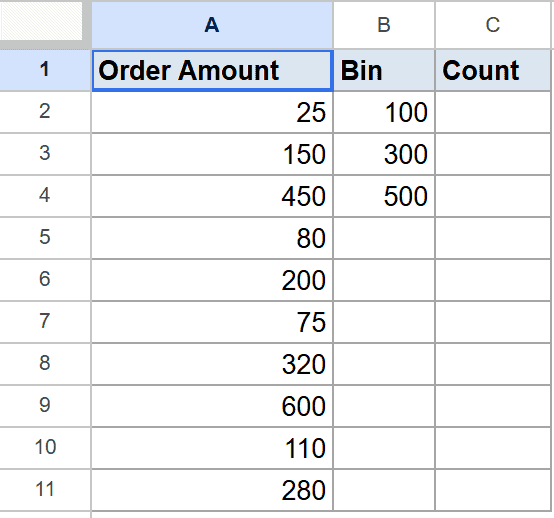
Below is the dataset. Column A has ten order amounts and column B has tier edges at 100, 300, and 500.
I want to see how many orders land in each price tier, including anything above 500.
Here is the formula:
=FREQUENCY(A2:A11, B2:B4)
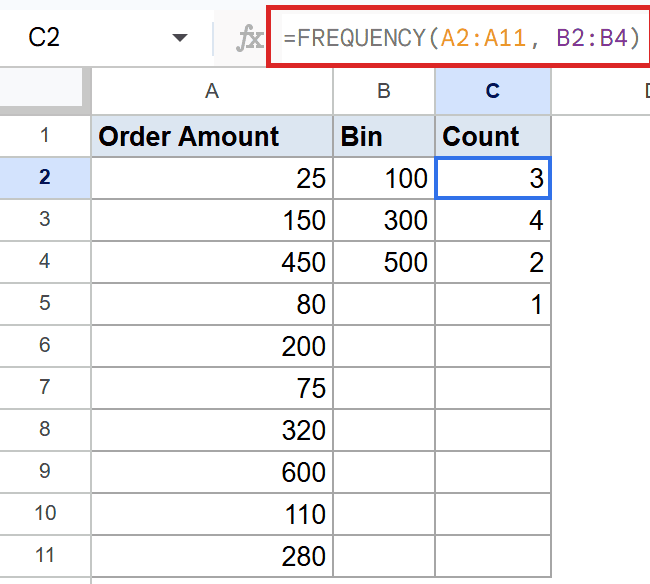
Three orders are 100 or below, four are between 101 and 300, two sit between 301 and 500, and one order goes above the top tier and lands in the overflow row.
That overflow bucket is one of the best parts of FREQUENCY. You never lose values that exceed your top bin. They get their own count at the bottom.
Example 4: Distribute Response Times Across Bins
Bins don’t have to be whole numbers. Decimal values work the same way.
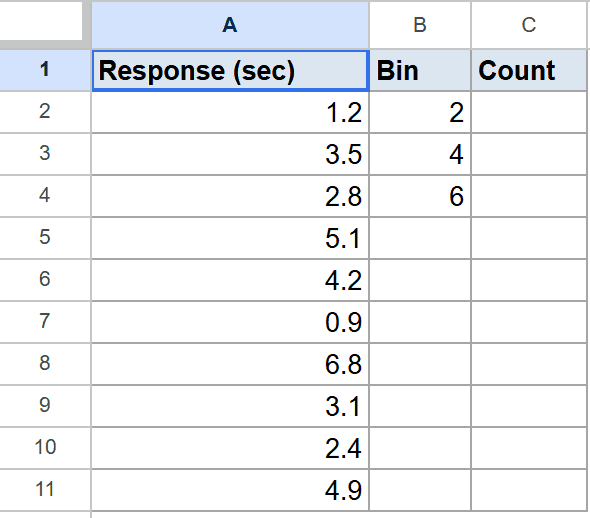
Below is the dataset. Column A has ten response times in seconds, some with decimals, and column B has bin edges at 2, 4, and 6.
I want a count of responses in each speed band.
Here is the formula:
=FREQUENCY(A2:A11, B2:B4)
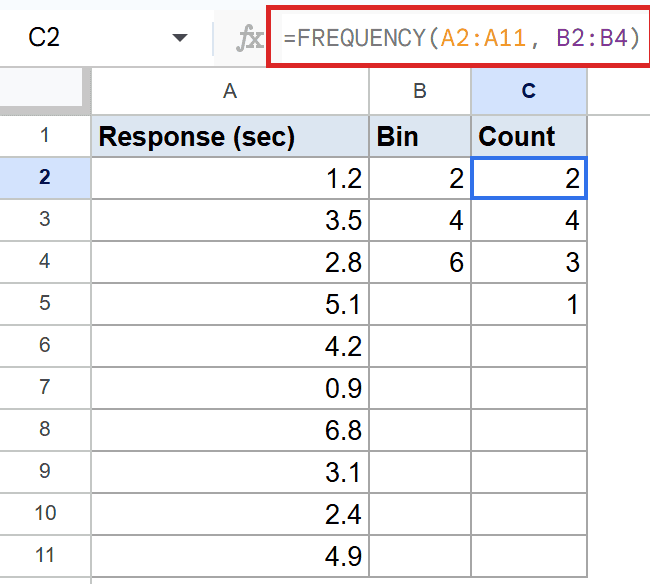
Two responses come in at 2 seconds or under, four sit between 2.01 and 4, three fall between 4.01 and 6, and one is slower than 6 seconds.
Decimal bins are handy when your data has fractional units like seconds, dollars, or percentages. FREQUENCY handles them the same way it handles whole numbers.
Tips & Common Mistakes
- The result is always one row taller than your bins list. FREQUENCY adds an overflow row at the bottom for anything above the top bin edge. Leave enough room below the formula cell or the spill will be blocked.
- Bin edges are inclusive on the upper bound. A value of exactly 80 with a bin of 80 lands in that bin, not the next one up. If you need the opposite behavior, shift your bins down by one unit.
- Don’t fill the formula down manually. FREQUENCY spills its results automatically. Typing it into B2 and dragging down will give you duplicate single values instead of the full distribution.
FREQUENCY turns a column of raw numbers into a count per bucket without any helper columns.
You’ve now seen it grouping test scores, ages, sales orders, and decimal response times. Pick your bin edges, point it at your data, and read the spill.
List of All Google Sheets Functions
Related Google Sheets Functions / Articles: