If you have a set of known data points and want to predict a future value that follows the same trend, the FORECAST function in Google Sheets does exactly that. It fits a straight line through your known points and reads off the y value for any x you ask about.
In this article, I’ll walk you through how FORECAST works with four hands-on examples.
FORECAST Function Syntax in Google Sheets
Here is how the FORECAST function is written:
=FORECAST(x, data_y, data_x)
- x is the value you want a prediction for.
- data_y is the range of known y values (the results you already have).
- data_x is the range of known x values that line up with those results.
The function looks at the relationship between your known x and y values, draws the best-fit straight line, and returns where your new x lands on that line.
When to Use FORECAST Function
- Predicting next month’s sales when past months follow a steady trend.
- Estimating an outcome for an input you haven’t tried yet, like a new ad budget.
- Projecting where a falling or rising metric will be a few periods out.
- Filling in a likely value between or beyond points you already measured.
- Giving a quick, formula-based estimate without building a full chart.
Example 1: Predict the Next Month’s Sales
Let’s start with the classic case, projecting the next point in a series.
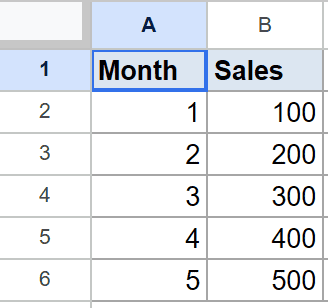
Below is the dataset. Column A holds the month number 1 through 5, and column B holds the sales for each of those months.
I want to predict the sales for month 6, the next month in the series.
Here is the formula:
=FORECAST(6, B2:B6, A2:A6)
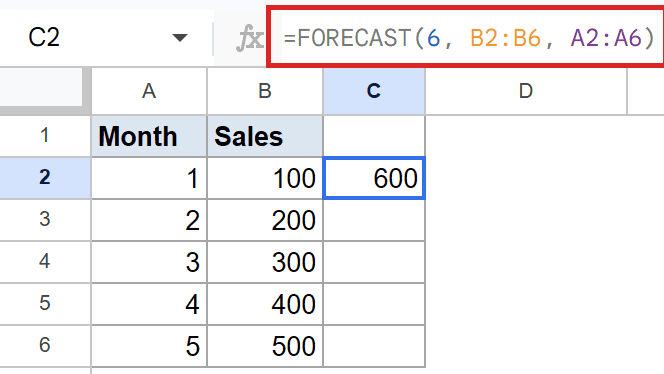
The formula returns 600. Sales climb by 100 each month, so the trend line continues cleanly and month 6 lands right at 600.
The first argument is the x I’m asking about (month 6). The second is the known sales, and the third is the known months those sales belong to.
Pro Tip: Google Sheets also has FORECAST.LINEAR, a newer name for the exact same calculation. If you see it in a shared sheet, treat it as identical to FORECAST.
Example 2: Forecast Sales From Ad Spend
The x you predict for doesn’t have to be the next number in a sequence. It can be any value.
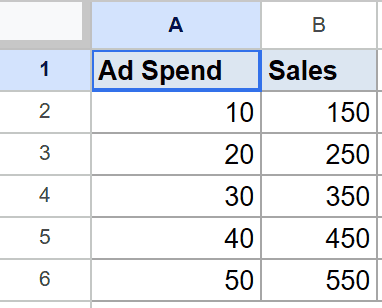
Below is the dataset. Column A holds ad spend in dollars, and column B holds the sales that came from each spend level.
I want to estimate the sales if I spend 60, which is higher than anything in the table.
Here is the formula:
=FORECAST(60, B2:B6, A2:A6)
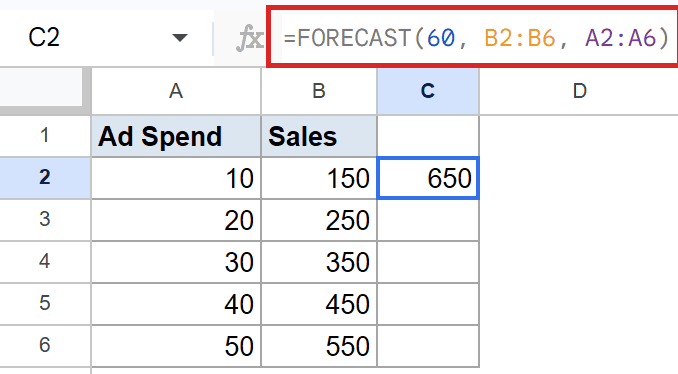
The formula gives 650. Each extra 10 in spend adds 100 in sales, so a spend of 60 sits one step past the last row and the line predicts 650.
FORECAST is happy to predict beyond your known range like this. Just remember the estimate only holds if the trend keeps behaving the same way.
Example 3: Forecast a Declining Trend
FORECAST works just as well when the numbers are falling.
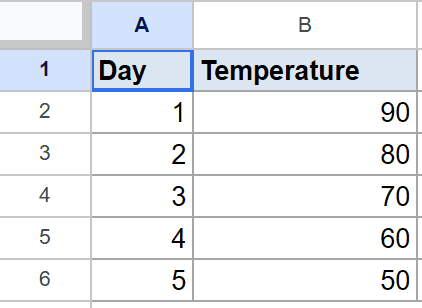
Below is the dataset. Column A holds the day number 1 through 5, and column B holds a temperature reading that drops each day.
I want to predict the temperature on day 8, a few days past the last reading.
Here is the formula:
=FORECAST(8, B2:B6, A2:A6)
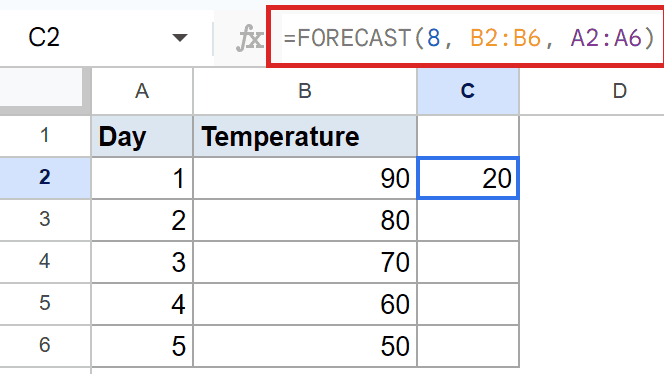
The formula returns 20. The temperature falls by 10 each day, so the downward line keeps going and day 8 lands at 20.
Nothing special is needed for a declining series. FORECAST just fits the line to whatever direction your data points to.
Example 4: Project Website Visits Two Weeks Out
A longer history gives FORECAST more points to fit its line to.
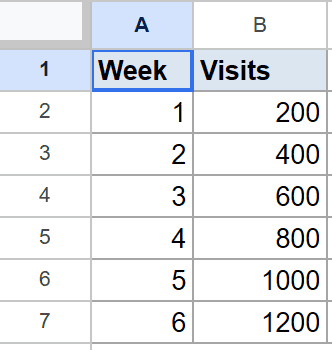
Below is the dataset. Column A holds the week number 1 through 6, and column B holds the website visits for each week.
I want to project the visits for week 8, two weeks past the last recorded week.
Here is the formula:
=FORECAST(8, B2:B7, A2:A7)
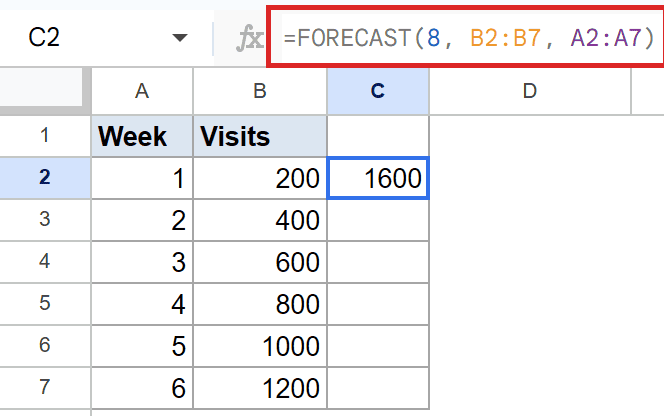
The formula yields 1600. Visits grow by 200 each week, so the trend line projects week 8 at 1600.
Notice the ranges now run down to row 7 because there are six weeks of history. More clean data points make the fitted line steadier.
Pro Tip: Make sure both your data_y and data_x ranges cover the same number of rows. If one is longer than the other, FORECAST returns an error.
Tips & Common Mistakes
- Keep the two ranges the same size. data_y and data_x must have a matching number of values. A mismatch returns an error instead of a prediction.
- FORECAST assumes a straight line. It always fits a linear trend. If your real data curves or jumps around, the prediction can be way off, so eyeball the numbers first.
- Watch the argument order. It’s x first, then the known y values, then the known x values. Swapping data_y and data_x quietly gives you the wrong answer with no error.
That covers the FORECAST function in Google Sheets. You’ve seen it predict the next point in a series, estimate from a new input, follow a falling trend, and project further out with a longer history.
Try it on your own data and you’ll have a quick estimate without touching a chart.
List of All Google Sheets Functions
Related Google Sheets Functions / Articles: