
FORECAST.LINEAR estimates a Y value at a chosen X using a straight line fitted to known pairs. It can extend a trend or estimate a point within the observed range; the result is an estimate.
FORECAST.LINEAR function syntax
=FORECAST.LINEAR(x, data_y, data_x)- x: the input value at which to estimate Y.
- data_y: the known output values, such as revenue.
- data_x: the corresponding input values, such as month numbers. Pair X and Y values in the same order and use equally sized numeric ranges.
Set up the example data
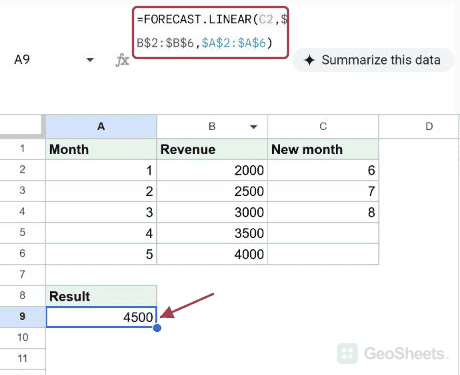
Enter this dataset starting in A1. The first row contains headings. Keep the result area separate from the source table.
| Month | Revenue | New month |
|---|---|---|
| 1 | 2000 | 6 |
| 2 | 2500 | 7 |
| 3 | 3000 | 8 |
| 4 | 3500 | |
| 5 | 4000 |
Project revenue for an upcoming month
Enter this formula in A9. The example increases by 500 per month, so the fitted line estimates 4500 for month 6. Dollar signs lock the known ranges when you copy the formula.
=FORECAST.LINEAR(C2,$B$2:$B$6,$A$2:$A$6)Result: 4500.
Return several future estimates
The target months in C2:C4 are 6, 7 and 8. ARRAYFORMULA returns 4500, 5000 and 5500 vertically from the same known data.
=ARRAYFORMULA(FORECAST.LINEAR(C2:C4,$B$2:$B$6,$A$2:$A$6))Result: 4500; 5000; 5500.
Estimate conversions at an ad-spend level
For spend values 100, 200 and 300, suppose observed conversions are 10, 20 and 30. This example estimates 35 conversions at spend 350 using the paired arrays.
=FORECAST.LINEAR(350,{10;20;30},{100;200;300})Result: 35.
Extend a falling temperature trend
For days 1, 2 and 3, this example uses temperatures 30, 28 and 26. The fitted line estimates 24 for day 4. A negative slope works without changing the syntax.
=FORECAST.LINEAR(4,{30;28;26},{1;2;3})Result: 24.
Estimate calls per hour after training
With training hours 5, 10 and 15 paired with call rates 12, 14 and 16, the line estimates 18 calls per hour at 20 training hours.
=FORECAST.LINEAR(20,{12;14;16},{5;10;15})Result: 18.
Estimate salary from experience
For experience levels 1, 3 and 5 years, this illustrative dataset uses salaries of 40, 50 and 60 thousand. At 7 years the fitted line gives 70 thousand.
=FORECAST.LINEAR(7,{40;50;60},{1;3;5})Result: 70.
Check FORECAST compatibility and invalid inputs
FORECAST uses the same argument order and returns 4500 on the example data. If all known X values are identical, the slope cannot be fitted and the native test returns #DIV/0!.
=FORECAST(C2,$B$2:$B$6,$A$2:$A$6)Result: 4500.
Other Google Sheets articles you may also like