
CORREL measures the strength and direction of a linear relationship between paired numeric observations. Its result ranges from negative one to positive one; it does not establish causation.
CORREL function syntax
=CORREL(data_y, data_x)- data_y and data_x: equally sized ranges of paired measurements.
Set up the example data
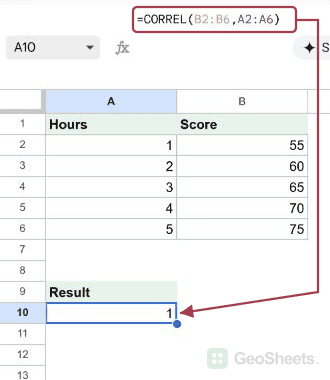
Enter this small dataset starting in A1. The first row contains headers. Keep the formula output separate from the input cells.
| Hours | Score |
|---|---|
| 1 | 55 |
| 2 | 60 |
| 3 | 65 |
| 4 | 70 |
| 5 | 75 |
Measure a positive relationship
Enter this formula in A10. These illustrative scores increase by five for every additional hour. The points lie on a straight rising line, giving a perfect positive coefficient.
=CORREL(B2:B6,A2:A6)Result: 1.
Compare another positive series
This fictional reaction-time series increases with hours of lost sleep. It illustrates the calculation, not evidence from a study.
=CORREL({200;220;240;260;280;300},{0;1;2;3;4;5})Result: 1.
Recognize zero linear correlation
The symmetric curved relationship has zero linear correlation. A zero coefficient therefore does not prove the variables are unrelated.
=CORREL({4;1;0;1;4},{-2;-1;0;1;2})Result: 0.
Measure a negative relationship
These illustrative unit counts fall as prices rise. CORREL describes the paired observations; it does not prove that changing the price caused the difference.
=CORREL({100;90;80;70;60},{10;11;12;13;14})Result: -1.
Handle constant input
Correlation is undefined when either variable has no variation. Correct or reconsider the input instead of replacing this error with a coefficient of zero.
=CORREL({5;5;5},{1;2;3})Result: #DIV/0!.
Other Google Sheets articles you may also like