
LINEST fits a least-squares straight-line model in Google Sheets. With one predictor, its default result contains the slope and intercept in two adjacent cells.
You can request regression statistics or supply multiple predictor columns. Leave enough empty cells for the result, and label the outputs before using them in another calculation.
LINEST function syntax
=LINEST(known_data_y, [known_data_x], [calculate_b], [verbose])- known_data_y: the dependent observations.
- known_data_x: matching predictor values; omitted values use 1, 2, 3, and so on.
- calculate_b: TRUE or omitted estimates the intercept; FALSE forces it to zero.
- verbose: TRUE returns additional statistics; FALSE or omitted returns coefficients only.
The Google LINEST reference describes the function arguments.
Example data
Enter this dataset starting in A1. Leave cells marked “leave empty” empty; type any displayed formula as a formula. Keep a separate blank area for the results.
| x | y |
|---|---|
| 1 | 3 |
| 2 | 5 |
| 3 | 7 |
| 4 | 9 |
| 5 | 11 |
The examples below use this dataset unless the formula supplies its own values. Array results need enough empty cells to expand. The formulas use commas as argument separators. Your spreadsheet locale may require semicolons.
Find the slope and intercept
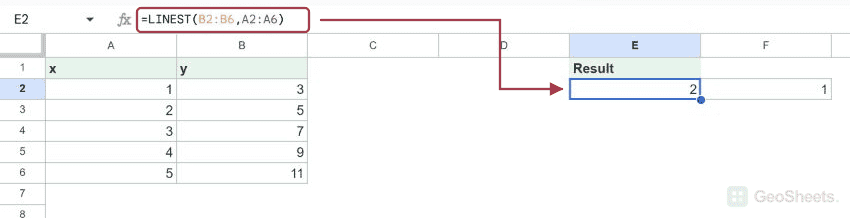
Enter the formula in E2. The first output is slope 2 and the second is intercept 1, giving the fitted equation y = 2x + 1.
=LINEST(B2:B6,A2:A6)| 2 | 1 |
Extract one coefficient
INDEX selects the first output, the slope.
=INDEX(LINEST(B2:B6,A2:A6),1,1)Result: 2
The second output is the intercept. Use explicit positions instead of assuming a single-cell LINEST result.
=INDEX(LINEST(B2:B6,A2:A6),1,2)Result: 1
Fit a decreasing relationship
The slope is -3 and the intercept is 20. The fitted equation is y = -3x + 20.
=LINEST({17;14;11;8;5},A2:A6)| -3 | 20 |
Omit x or force the intercept to zero
Omitting x uses the sequence 1 through 5 for these five y observations, which matches this dataset.
=LINEST(B2:B6)| 2 | 1 |
FALSE fits through the origin. The live output still contains two cells: slope 3 and intercept 0.
=LINEST({3;6;9;12;15},A2:A6,FALSE)| 3 | 0 |
Request the regression statistics
TRUE for verbose returns five rows. For one predictor, the columns are paired as described below.
=LINEST({4;4;8;8;12},A2:A6,TRUE,TRUE)| 2 | 1.2 |
| 0.4 | 1.326649916 |
| 0.8928571429 | 1.264911064 |
| 25 | 3 |
| 40 | 4.8 |
Fit more than one predictor
The supplied array contains two predictor columns. LINEST returns their coefficients in reverse column order, followed by the intercept: 2.5, 2.2, and 2.3.
=LINEST({9;12;17;16;23},{1,2;2,2;3,3;4,2;5,4})| 2.5 | 2.2 | 2.3 |
Other Google Sheets articles you may also like