
SLOPE returns the slope of a least-squares regression line in Google Sheets. It describes the fitted change in y for a one-unit increase in x.
Put the dependent values first and the independent values second. Reversing those ranges changes the question and the units of the answer.
SLOPE function syntax
=SLOPE(data_y, data_x)- data_y: the dependent or response values.
- data_x: the corresponding independent or explanatory values.
The Google SLOPE reference describes the function arguments.
Example data
Enter this dataset starting in A1. Leave cells marked “leave empty” empty; type any displayed formula as a formula. Keep a separate blank area for the results.
| Week | Revenue |
|---|---|
| 1 | 200 |
| 2 | 300 |
| 3 | 400 |
| 4 | 500 |
| 5 | 600 |
The examples below use this dataset unless the formula supplies its own values. Array results need enough empty cells to expand. The formulas use commas as argument separators. Your spreadsheet locale may require semicolons.
Calculate the slope of a steady increase
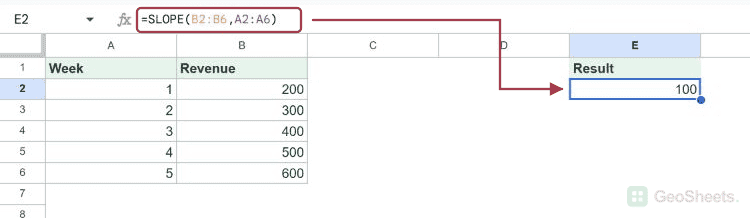
Revenue rises by 100 for each additional week. The fitted slope is therefore 100 revenue units per week.
=SLOPE(B2:B6,A2:A6)Result: 100
Fit observations that do not lie on one line
These measurements vary around a line. The least-squares fit estimates an increase of 3.5 y-units per x-unit; it does not average separate row-to-row percentage changes.
=SLOPE({60;65;67;74;73},{1;2;3;4;5})Result: 3.5
Interpret a negative slope
The dependent value falls by 10 for each one-unit increase in x. A negative slope describes the fitted downward direction.
=SLOPE({50;40;30;20;10},A2:A6)Result: -10
Use calendar years as x-values
The years increase in one-year steps, so the slope is 4 units per year. Real date serials would instead give a slope per day.
=SLOPE({10;14;18;22;26},{2022;2023;2024;2025;2026})Result: 4
Keep the range order and pairs correct
Reversing the ranges gives weeks per revenue unit. That is a different regression, not the original slope with a different label.
=SLOPE(A2:A6,B2:B6)Result: 0.01
A pair whose y value is an empty string is excluded here. Keep each remaining x aligned with its corresponding y.
=SLOPE({2;"";6},{1;2;3})Result: 2
Check inputs that cannot produce a slope
If every x value is 5, there is no variation in x and the slope is undefined. Sheets returns #DIV/0!.
=SLOPE({1;2;3},{5;5;5})Result: #DIV/0!
Mismatched range sizes return #N/A. Select corresponding observations with the same shape.
=SLOPE(B2:B6,A2:A5)Result: #N/A
Other Google Sheets articles you may also like