
FORECAST fits a straight line to paired observations and estimates y for a chosen x. It can interpolate within the measured range or extrapolate beyond it, with no guarantee the trend will continue.
FORECAST function syntax
=FORECAST(x, data_y, data_x)- x: input to estimate for.
- data_y: known outcomes.
- data_x: corresponding known inputs in the same row order.
Set up the example data
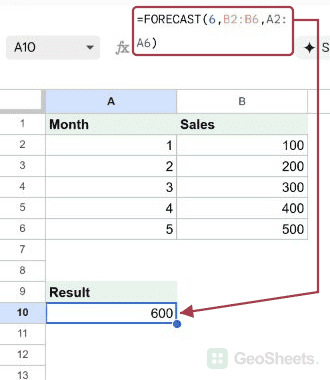
Enter this small dataset starting in A1. The first row contains headers. Keep the formula output separate from the input cells.
| Month | Sales |
|---|---|
| 1 | 100 |
| 2 | 200 |
| 3 | 300 |
| 4 | 400 |
| 5 | 500 |
Estimate the next month
Enter this formula in A10. The illustrative sales rise by one hundred per month. The fitted line therefore gives six hundred for month six.
=FORECAST(6,B2:B6,A2:A6)Result: 600.
Estimate sales from a new ad budget
The first argument is the new spend. Known sales come second and known spend third. This model describes a pattern; it does not establish an advertising effect.
=FORECAST(60,{150;250;350;450;550},{10;20;30;40;50})Result: 650.
Extend a declining trend
The same calculation fits a falling line. Extrapolation can eventually produce impossible values for metrics that cannot be negative.
=FORECAST(8,{90;80;70;60;50},{1;2;3;4;5})Result: 20.
Project visits two periods ahead
Six illustrative weekly totals establish this linear pattern. Week eight is two periods beyond the last observation.
=FORECAST(8,{200;400;600;800;1000;1200},{1;2;3;4;5;6})Result: 1600.
Check a constant input axis
A constant x range cannot establish a slope. Supply paired inputs with variation and equally sized ranges.
=FORECAST(4,{10;20;30},{1;1;1})Result: #DIV/0!.
Other Google Sheets articles you may also like