If you have a set of paired numbers, like months and revenue, or training hours and productivity, the FORECAST.LINEAR function in Google Sheets can predict where the next value lands on the trend line.
It fits a straight line through your known data and reads off the answer for a new input. In this article, I’ll show you five practical examples covering revenue, ad spend, temperature, productivity, and salary.
FORECAST.LINEAR Function Syntax in Google Sheets
Here is how the FORECAST.LINEAR function is written:
=FORECAST.LINEAR(x, data_y, data_x)
- x is the new input value you want a prediction for.
- data_y is the range of known Y values, the thing you want to predict.
- data_x is the range of known X values, the thing your prediction depends on.
The order trips people up. Known Y comes BEFORE known X.
When to Use FORECAST.LINEAR Function
- Project next month’s revenue from a steady history.
- Estimate conversions, leads, or sign-ups at a higher ad-spend level.
- Extend a falling or rising trend a few steps into the future.
- Predict productivity at a level of training you haven’t measured yet.
- Pull a quick best-fit estimate without building a chart.
Example 1: Project Revenue For Upcoming Months
Let’s start with the most common case, projecting future revenue from a few months of history.
Below is the dataset, with the month number in column A, the revenue in column B, the future month you want a forecast for in column C, and an empty column D for the result, across rows 2 to 6.
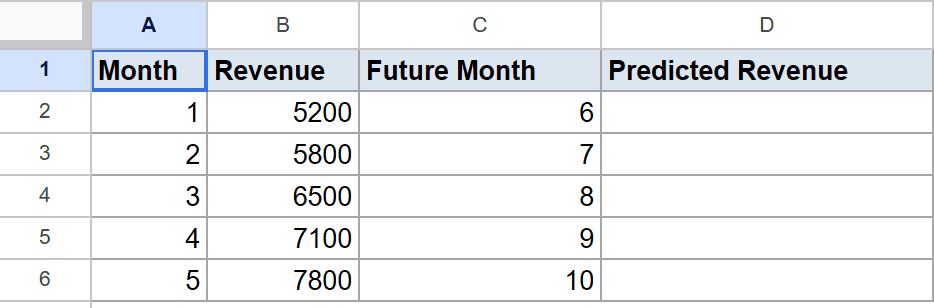
You want a revenue prediction for months 6 through 10 based on the trend in months 1 to 5.
Here is the formula:
=FORECAST.LINEAR(C2, $B$2:$B$6, $A$2:$A$6)
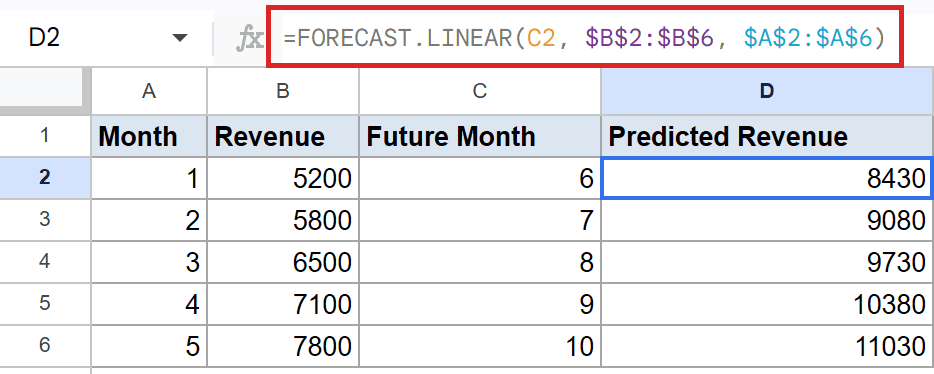
FORECAST.LINEAR fits a straight line through your five known points, then reads off the Y value at the new X you passed in. The first row gives 8430 for month 6.
The dollar signs around $B$2:$B$6 and $A$2:$A$6 keep the known ranges locked when you fill the formula down. Only C2 changes from row to row, so each row gets its own future-month prediction.
Pro Tip: FORECAST and FORECAST.LINEAR are the same function. FORECAST.LINEAR is the newer canonical name, and the older FORECAST works identically for backward compatibility. Use whichever you prefer.
Example 2: Forecast Conversions From Ad Spend Levels
Marketing spend is another classic forecasting case.
Below is the dataset, with the ad spend in column A, the conversions at that spend in column B, planned spend levels in column C, and an empty column D for the prediction, across rows 2 to 6.
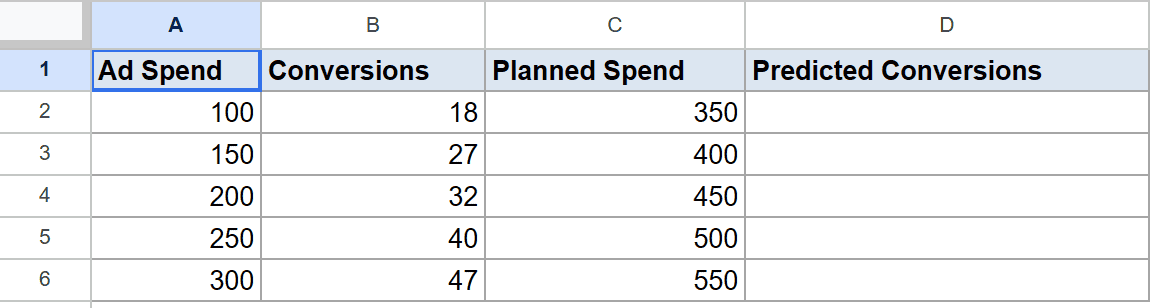
You want to know roughly how many conversions to expect at spend levels of 350 through 550, based on what you saw at 100 through 300.
Here is the formula:
=FORECAST.LINEAR(C2, $B$2:$B$6, $A$2:$A$6)
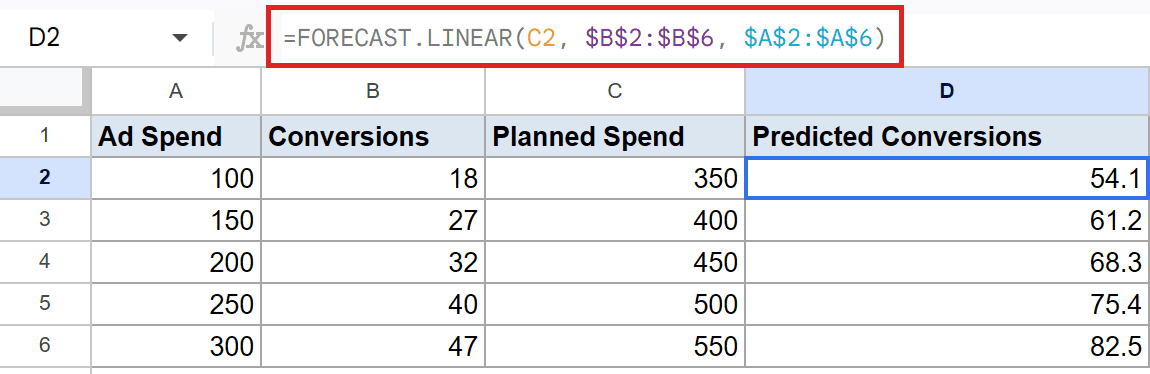
The function fits a line through the five known spend-and-conversion pairs and predicts the conversion count at each planned spend. The first row predicts about 54.1 conversions for a spend of 350.
Notice how the predictions step up in a clean linear pattern. That’s the nature of FORECAST.LINEAR, it assumes the relationship between input and output is a straight line, so it extends that line forward.
Example 3: Extend A Falling Temperature Trend
FORECAST.LINEAR works just as well on data that’s heading down.
Below is the dataset, with the day number in column A, the daily temperature in column B, the future day in column C, and an empty column D, across rows 2 to 6.
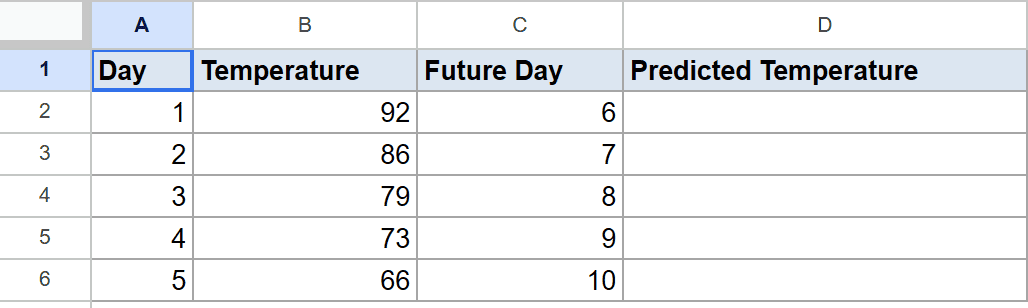
You want temperature predictions for days 6 through 10 based on a steady drop over the first five days.
Here is the formula:
=FORECAST.LINEAR(C2, $B$2:$B$6, $A$2:$A$6)
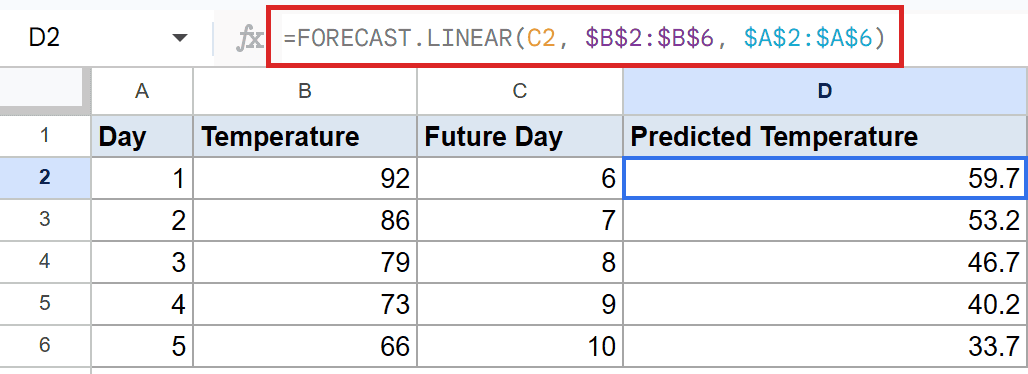
The slope of the fitted line is negative here, so each future day comes in lower than the last. Day 6 lands at 59.7, day 7 at 53.2, and so on, dropping cleanly to 33.7 by day 10.
Sign doesn’t matter to FORECAST.LINEAR. The function just fits the best straight line through your data and reads off the new value, whether the slope is positive or negative.
Example 4: Predict Calls Per Hour After Training
This one is useful for any productivity-versus-training kind of analysis.
Below is the dataset, with training hours in column A, the resulting calls per hour in column B, target hours in column C, and an empty column D, across rows 2 to 6.
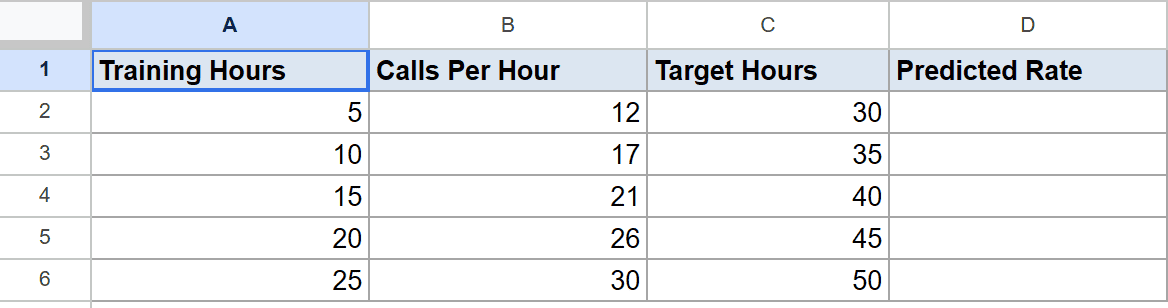
You want to know what call rate to expect if you bumped training up to 30, 35, 40, 45, or 50 hours.
Here is the formula:
=FORECAST.LINEAR(C2, $B$2:$B$6, $A$2:$A$6)
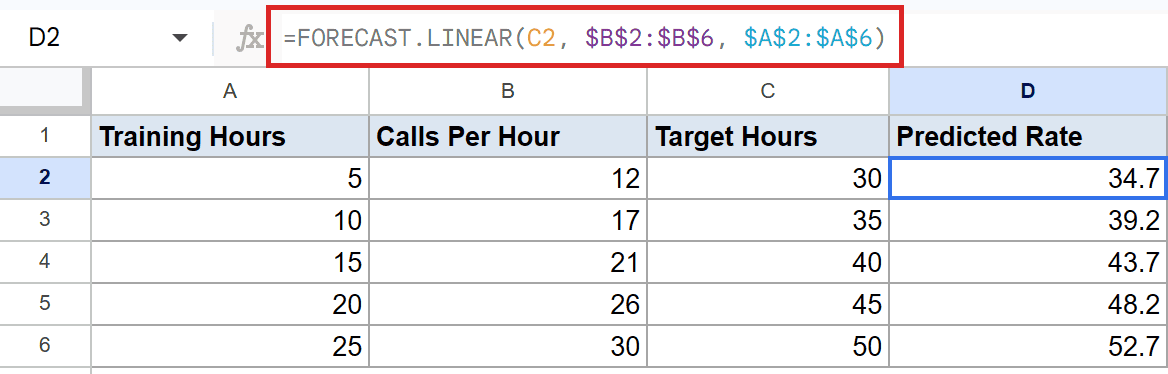
The first row predicts about 34.7 calls per hour at 30 training hours, and the trend keeps climbing from there.
A small caveat. Your data covers 5 to 25 training hours, and you’re asking about levels above that. That’s called extrapolation, and predictions further from your known range get less reliable. A real-world training program probably hits diminishing returns at some point, so don’t take 52.7 calls per hour at 50 training hours as gospel.
Example 5: Estimate Salary Growth From Years Of Experience
Salary versus experience is a fair fit for a linear forecast over a modest range.
Below is the dataset, with years of experience in column A, salary in thousands in column B, future experience levels in column C, and an empty column D, across rows 2 to 6.
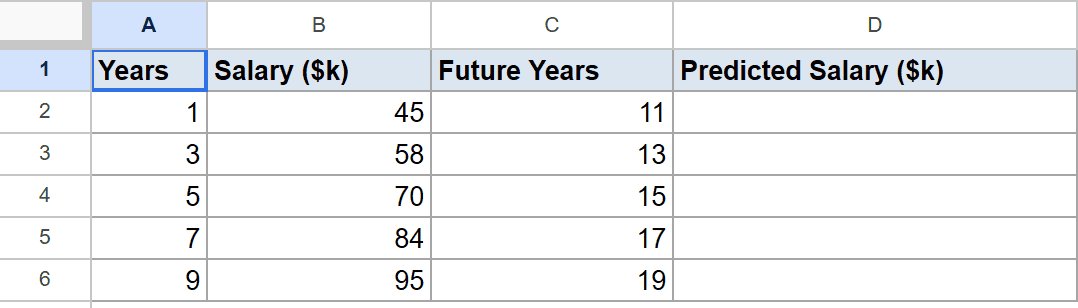
You want salary predictions at 11, 13, 15, 17, and 19 years of experience based on five known data points from 1 to 9 years.
Here is the formula:
=FORECAST.LINEAR(C2, $B$2:$B$6, $A$2:$A$6)
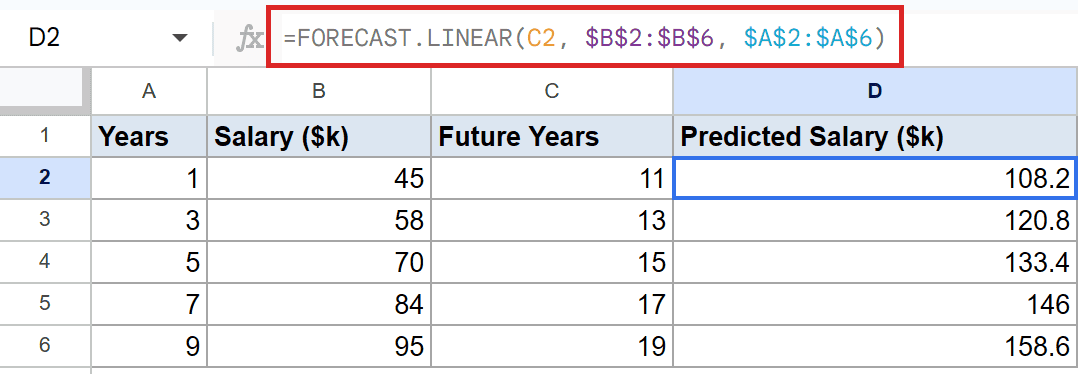
The first row predicts a salary of 108.2k at 11 years, and the line keeps climbing to 158.6k at 19 years.
Note that the X values in column A aren’t evenly spaced. They’re 1, 3, 5, 7, 9. FORECAST.LINEAR handles that fine. It doesn’t need a tidy 1, 2, 3 sequence, it just needs paired numbers.
Tips & Common Mistakes
- The argument order is target X, then known Y, then known X. People who came from Excel’s old habit of “X first, Y second” often flip the last two arguments and get nonsense numbers back. Remember: the value you want to predict (Y) comes BEFORE the input you already have (X).
- Linear means linear. FORECAST.LINEAR assumes a straight-line relationship. For curved data, like sales with seasonality or growth that compounds, it will give you a wrong answer with a confident face. For curves, look at GROWTH or LOGEST instead.
- Extrapolation accuracy drops with distance. Predicting one step past your known data is usually safe. Predicting ten steps out is a guess. Always sanity-check the result against what you know about the underlying process.
FORECAST.LINEAR is one of those functions that earns its place when you need a quick best-fit estimate without leaving the spreadsheet. Plug in your known pairs, point it at the new X, and you have your prediction.
Just keep in mind it draws a straight line. If your data wants to curve, use a different tool.
List of All Google Sheets Functions
Related Google Sheets Functions / Articles: