If you want to find the slope and intercept of a straight line that best fits your data, the LINEST function in Google Sheets gives you both in one go. It looks at your x and y values and works out the line that runs closest through them.
In this article, I’ll show you how to use LINEST with simple datasets, how to force the line through zero, and how it handles a downward trend.
LINEST Function Syntax in Google Sheets
Here is how the LINEST function is written.
=LINEST(known_data_y, [known_data_x], [calculate_b], [verbose])
- known_data_y: the range of y values (the results you measured).
- known_data_x: the range of x values that go with each y. Optional. If you skip it, Sheets uses 1, 2, 3 and so on.
- calculate_b: optional TRUE or FALSE. TRUE (the default) lets the line have its own intercept. FALSE forces the intercept to zero.
- verbose: optional TRUE or FALSE. FALSE (the default) returns just the slope and intercept. TRUE adds extra regression stats.
When to Use LINEST Function
- You want the slope and intercept of a trend line in a single formula.
- You are fitting a straight line to sales, scores, or sensor readings over time.
- You need the line to start at the origin, so the intercept must be zero.
- You want the underlying numbers behind a chart trendline, not just the picture.
Example 1: Get the Slope and Intercept
Let’s start with the most common job for LINEST.
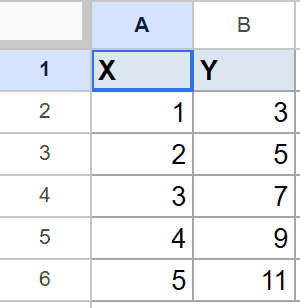
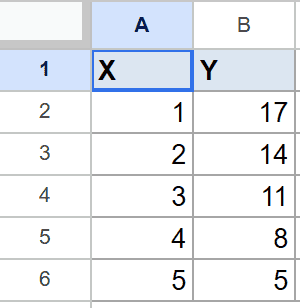
Below is the dataset. Column A holds the x values and column B holds the matching y values.
The goal is to find the slope and intercept of the line that fits these five points.
Here is the formula:
=LINEST(B2:B6, A2:A6)
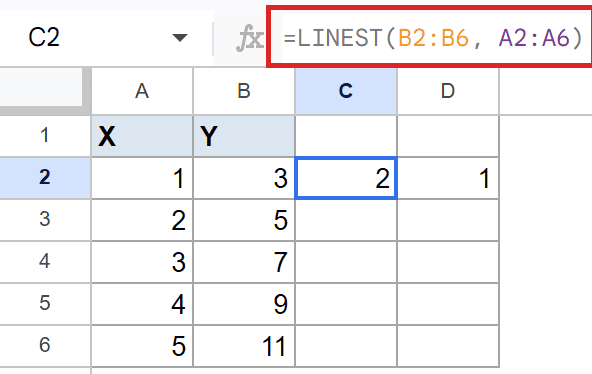
LINEST does not return a single number. By default it gives back a two-cell horizontal array, with the slope first and the intercept right after it.
So here the slope is 2 and the intercept is 1. The slope sits in C2 and the intercept spills into D2 on its own.
In plain terms, every time x goes up by 1, y goes up by 2, and the line crosses the y axis at 1.
Pro Tip: If you only need the slope or only the intercept as a single value, the SLOPE and INTERCEPT functions each return just one number, which is easier to reference in another formula.
Example 2: Force the Line Through Zero
Sometimes you know the line has to start at zero, like revenue from zero sales.
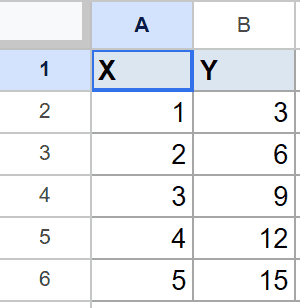
Below is the dataset. Column A again holds the x values and column B holds the y values, this time landing on a clean multiple.
The goal is to fit a line that passes through the origin, so the intercept is fixed at zero.
Here is the formula:
=LINEST(B2:B6, A2:A6, FALSE)
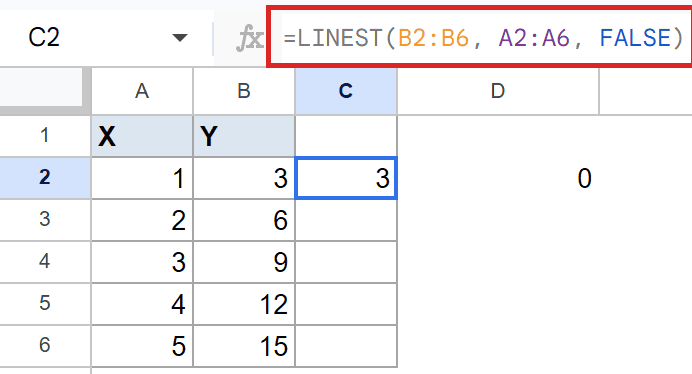
Setting the third argument to FALSE tells LINEST to skip the intercept and pin the line to zero.
Because there is no intercept to report, the formula returns a single value, and here the slope is 3. The line rises by 3 for every step of 1 along x, starting from the origin.
Example 3: Slope and Intercept for a Declining Line
LINEST handles a downward trend just as easily.
Below is the dataset. Column A holds the x values and column B holds y values that fall as x grows.
The goal is to confirm that LINEST reports a negative slope for a line heading down.
Here is the formula:
=LINEST(B2:B6, A2:A6)
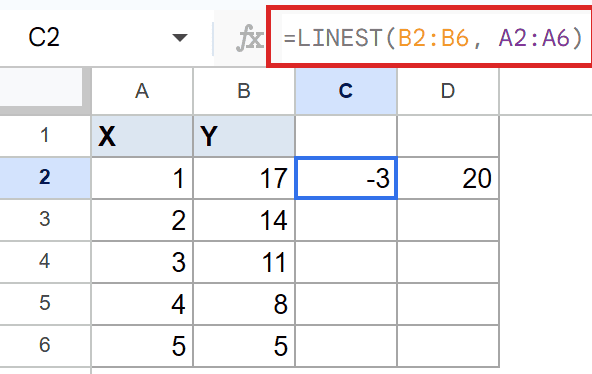
Same two-cell array as before, slope then intercept.
This time the slope is -3 and the intercept is 20. The negative slope means y drops by 3 for every step x takes to the right, and the line would cross the y axis at 20.
Tips & Common Mistakes
- LINEST returns an array, not one number. Leave the cell to the right empty so the intercept has room to spill, or you will see a #REF! error.
- The y range comes first, then the x range. Swapping them flips the result, so double-check the order.
- The optional third argument changes the output shape. TRUE gives slope and intercept. FALSE gives slope only.
LINEST is a quick way to pull the math behind a trend line straight into your sheet. Once you know it returns slope then intercept, the rest follows.
Try it on your own data with the default form first, then add the FALSE argument when you need the line to start at zero.
List of All Google Sheets Functions
Related Google Sheets Functions / Articles: