If you want to know how fast one value changes as another value goes up, the SLOPE function in Google Sheets gives you that rate as a single number. It fits a straight line through your data and reports how steep that line is.
In this article, I’ll show you how to use SLOPE on a clean trend, on scattered data, on a declining trend, and across calendar years.
SLOPE Function Syntax in Google Sheets
Here is how the SLOPE function is written.
=SLOPE(data_y, data_x)
- data_y: the range of y values, the results that depend on something else.
- data_x: the range of x values that go with each y, like weeks, hours, or years.
Both ranges must be the same size. SLOPE returns the rise in y for each one-unit step in x.
When to Use SLOPE Function
- You want the rate of change in revenue, scores, or temperature over time.
- You need the steepness of a best-fit line without drawing a chart.
- You are comparing how quickly two different trends are moving.
- You want a single number that sums up a trend’s direction and speed.
Example 1: Slope of a Steady Upward Trend
Let’s start with a clean, straight-line trend.
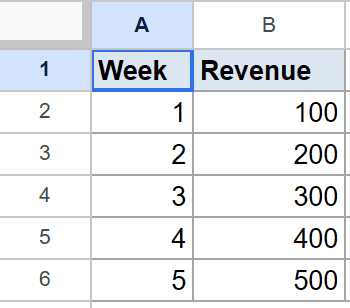
Below is the dataset. Column A holds the week number and column B holds the revenue for that week.
The goal is to find how much revenue rises with each passing week.
Here is the formula:
=SLOPE(B2:B6, A2:A6)
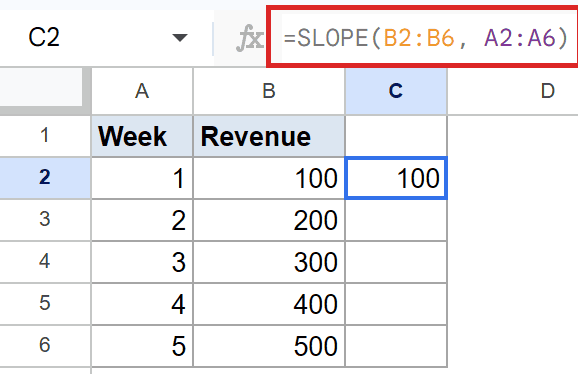
The y range comes first, then the x range. SLOPE works out the best-fit line and reports its steepness.
Here the result is 100, which means revenue goes up by 100 for every one-week step. Since these points already sit on a perfect line, the slope is exact.
Pro Tip: A common mistake is putting the x range first. SLOPE expects y then x, so flipping them gives you the wrong rate.
Example 2: Slope With Scattered Data
Real data rarely lands on a perfect line, and that is fine.
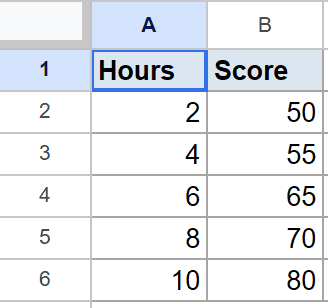
Below is the dataset. Column A holds hours studied and column B holds the test score for each.
The goal is to find the average gain in score per hour, even though the points wobble.
Here is the formula:
=SLOPE(B2:B6, A2:A6)
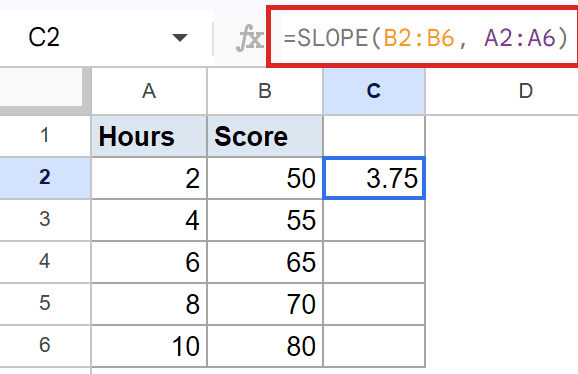
SLOPE draws the line that runs closest to all the points, then measures it.
Here the result is 3.75, so on average the score climbs by 3.75 points for each extra hour of study. The decimal is normal whenever the data does not fall on a clean line.
Example 3: A Negative Slope for a Declining Trend
SLOPE works just as well when the numbers fall.
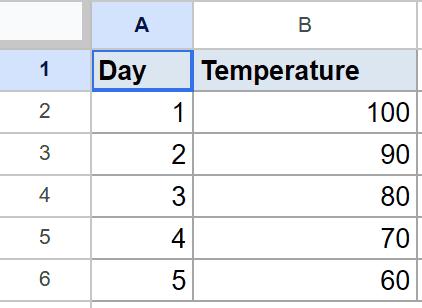
Below is the dataset. Column A holds the day and column B holds a temperature that drops each day.
The goal is to confirm SLOPE returns a negative number for a downward trend.
Here is the formula:
=SLOPE(B2:B6, A2:A6)
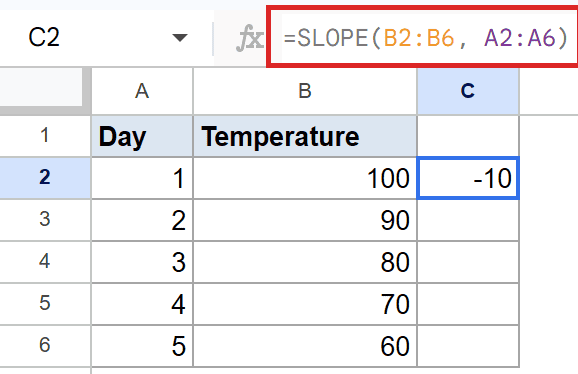
When y goes down as x goes up, the best-fit line tilts downward, so the slope is negative.
Here the result is -10, meaning the temperature drops by 10 each day. The minus sign is the part that tells you the trend is heading down.
Example 4: Slope Across Calendar Years
Your x values do not have to start at 1. They can be actual years.
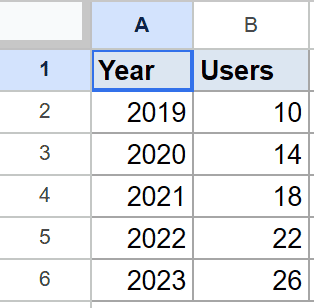
Below is the dataset. Column A holds the year and column B holds the number of users in that year.
The goal is to find the yearly rate at which users are growing.
Here is the formula:
=SLOPE(B2:B6, A2:A6)
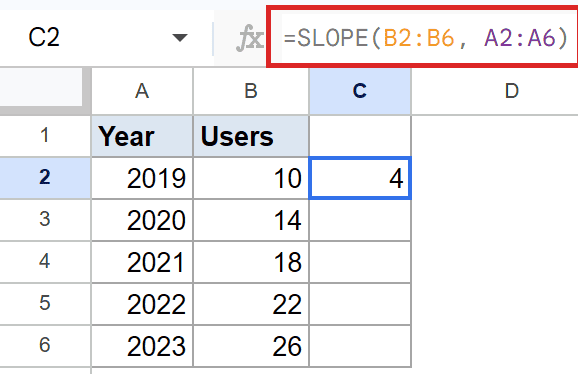
SLOPE treats the years as plain numbers and measures the gap between them, so steps of one year work the same as steps of 1.
Here the result is 4, which means users grow by 4 every year. Using real years on the x axis keeps the rate in terms you can read straight off.
Tips & Common Mistakes
- Put the y range first and the x range second. Swapping them is the most common SLOPE error and it quietly returns the wrong number.
- Both ranges must be the same length. A mismatch gives you an error instead of a result.
- SLOPE ignores text and blank cells in pairs. If a row is missing one value, that whole point is skipped, which can shift the result.
SLOPE turns a column of data into one clear number: how fast things are changing. A positive value rises, a negative value falls, and the size tells you how steep.
Try it on any two columns where one depends on the other, and you have the trend’s speed in a single cell.
List of All Google Sheets Functions
Related Google Sheets Functions / Articles: