
FREQUENCY counts how many numbers fall into each bin. Supply the data and the upper limits of your bins; Google Sheets returns a vertical list of counts, including one extra count above the highest limit.
FREQUENCY function syntax
=FREQUENCY(data, classes)- data: the numbers you want to group into intervals.
- classes: the bin boundaries. Use increasing boundaries to make the output easy to read.
- Each boundary is inclusive at its upper end. The final output counts numbers above the largest boundary.
Set up the example data
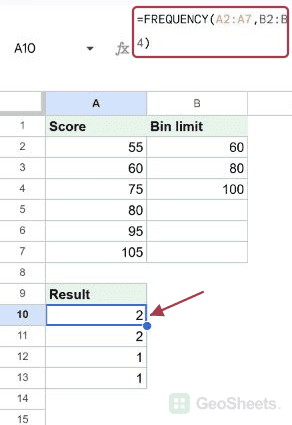
Enter this dataset starting in A1. The first row contains headings. Keep the result area separate from the source table.
| Score | Bin limit |
|---|---|
| 55 | 60 |
| 60 | 80 |
| 75 | 100 |
| 80 | |
| 95 | |
| 105 |
Count scores in grade bins
Enter this formula in A10. The three limits produce four counts: two scores at or below 60, two above 60 through 80, one above 80 through 100, and one above 100.
=FREQUENCY(A2:A7,B2:B4)Result: 2; 2; 1; 1.
Use the same pattern for age groups
This self-contained example groups ages using upper limits of 18, 30 and 50. It counts two people aged 18 or younger, two aged 19–30, one aged 31–50 and one older than 50.
=FREQUENCY({16;18;25;30;45;62},{18;30;50})Result: 2; 2; 1; 1.
Group order amounts into sales tiers
The limits are 100, 300 and 500. The four output rows include an overflow count for the 700 order, so amounts above your highest tier are still represented.
=FREQUENCY({50;100;150;300;450;700},{100;300;500})Result: 2; 2; 1; 1.
Handle decimal response times precisely
These response times use limits of 2, 4 and 6 seconds. The value 2.001 belongs in the second bin, even though it is smaller than 2.01.
=FREQUENCY({2;2.001;4;4.001;6;7},{2;4;6})Result: 1; 2; 2; 1.
Check the total before using the distribution
Summing the four frequency counts returns six, matching the six numeric scores in this example. This is a useful check before turning the distribution into a chart.
=SUM(FREQUENCY(A2:A7,B2:B4))Result: 6.
Other Google Sheets articles you may also like