
T.TEST returns a p-value for a comparison of two sets of observations in Google Sheets. Choose a paired test for matched measurements, or an independent two-sample test for separate groups.
The function returns a probability calculation, not a full statistical report. Define the comparison, tail choice, and significance threshold before examining the result.
T.TEST syntax and test types
=T.TEST(range1, range2, tails, type)| Argument | Meaning |
|---|---|
| range1, range2 | The two sets of numeric observations |
| tails | 1 for one-tailed; 2 for two-tailed |
| type = 1 | Paired observations |
| type = 2 | Independent samples with an equal-variance assumption |
| type = 3 | Independent samples without the equal-variance assumption (Welch) |
TTEST is also accepted as a function name. Type 1 requires correctly matched pairs; type 2 and type 3 are for independent groups. Sample sizes alone do not determine which design applies.
Choose the test from the study design
A before-and-after measurement on the same participant is paired. Measurements from unrelated people in two groups are independent. Do not select a test merely because it produces a smaller p-value.
For independent groups, Welch’s test does not require equal population variances. Use the equal-variance version only when that assumption is justified.
Observations must be numeric and the independence assumptions must fit the design. Small-sample t inference also needs a plausible normal model, especially for paired differences, without influential outliers.
Run a paired t-test
Enter this example in A1:C7. Each row records the same participant before and after a change. The example is illustrative, not evidence about a real intervention.
| Participant | Before | After |
|---|---|---|
| A | 70 | 75 |
| B | 74 | 76 |
| C | 68 | 72 |
| D | 80 | 85 |
| E | 77 | 80 |
| F | 72 | 78 |
=T.TEST(B2:B7,C2:C7,2,1)Result: approximately 0.000958. This two-tailed test checks a null hypothesis of zero mean paired difference. Keep each participant’s before and after measurements on the same row.
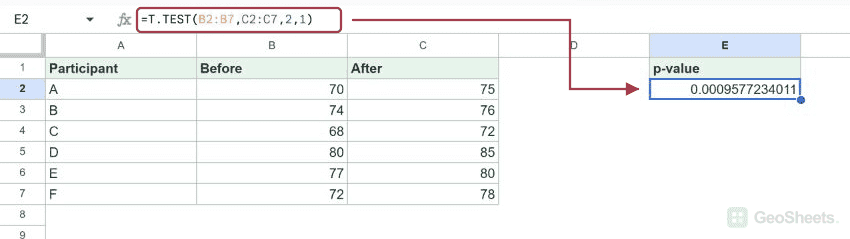
The average after-minus-before difference is about 4.17 points. At a preselected 0.05 threshold, this p-value provides evidence against a zero mean difference under the test assumptions.
=AVERAGE(C2:C7)-AVERAGE(B2:B7)A small p-value does not measure the practical importance of the change or prove that the intervention caused it. Report the measurement scale, sample size, and estimated difference alongside the test.
Run an independent two-sample t-test
For separate, unrelated groups, put their measurements in two columns. The formulas below reuse the example numbers to show the syntax; the before-and-after dataset itself should still be analyzed as paired.
=T.TEST(B2:B7,C2:C7,2,3)Welch result: approximately 0.138393. With a 0.05 threshold, this does not provide sufficient evidence to reject equal population means. It does not prove the means are equal.
=T.TEST(B2:B7,C2:C7,2,2)Equal-variance result: approximately 0.138390. The similar p-values here do not make the equal-variance assumption automatically appropriate for other datasets.
Independent samples may have different counts. The live tests accepted six versus five observations with types 2 and 3; a paired test with those unequal counts returned #N/A.
Choose one or two tails carefully
A two-tailed alternative allows a difference in either direction. A one-tailed alternative specifies a direction in advance, such as a positive after-minus-before mean change.
=T.TEST(B2:B7,C2:C7,1,1)Result: approximately 0.000479. Reversing the two ranges produced the same one-tailed value in the live test. The function does not encode your directional hypothesis simply through range order.
Check the observed direction against the prespecified alternative. Do not blindly halve a two-tailed p-value when the observed difference points the other way; the relevant directional probability is then large.
Compare one sample with a hypothesized mean
T.TEST has no one-sample test type. For a sample in B2:B7 and a hypothesized population mean of 75, calculate the t statistic and use T.DIST.2T for a two-tailed p-value.
=T.DIST.2T(ABS((AVERAGE(B2:B7)-75)/(STDEV(B2:B7)/SQRT(COUNT(B2:B7)))),COUNT(B2:B7)-1)Result: approximately 0.447632. This uses five degrees of freedom for six numeric observations. The calculation needs at least two observations and a nonzero sample standard deviation.
The formula tests the Before sample against 75. It answers a different question from whether the paired before-and-after means differ.
Check the inputs before interpreting a result
Exclude headings from the ranges. Check imported numbers, missing observations, and errors. For paired data, do not independently remove blanks or sort only one column, because that can break the pairings.
If both independent groups have zero variance, a standard error cannot be estimated in the usual way; the tested formula returned #DIV/0!. Changing tails does not repair invalid input.
A p-value is not the probability that the null hypothesis is true. It describes how extreme the observed statistic is under the null model and its assumptions.
See Google’s T.TEST reference and T.DIST.2T reference for function arguments.
Other Google Sheets articles you may also like